Mortgage Rates Today, 30-Year Fixed: 7.03% and Climbing (September 2026)

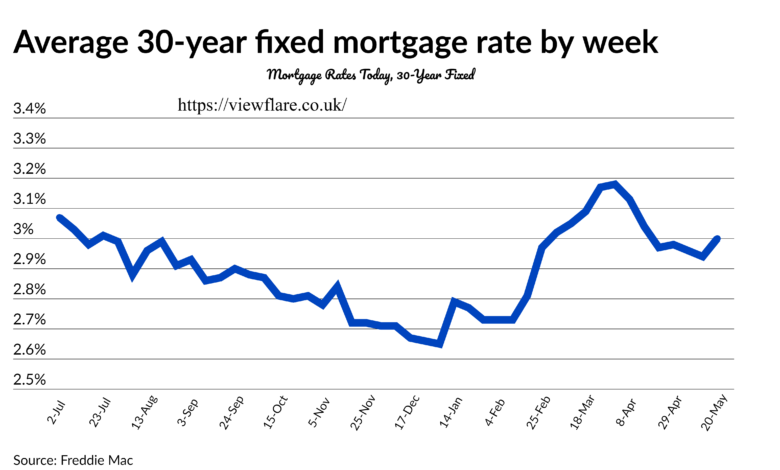
Mortgage Rates Today, 30-Year Fixed As of September 24, 2026, Freddie Mac’s weekly survey put the average 30-year fixed mortgage rate at 7.03%. That is up from 6.95% the week before and 6.30% a year ago. It is the first reading above 7% since January 2025.
If you are shopping for a home or thinking about refinancing, that number matters. It also isn’t the rate you will necessarily get. Below is what’s pushing rates up, what the increase means for your monthly mortgage payment, and how to shop smart in a market that has turned less friendly.
Freddie Mac publishes new numbers every Thursday, so the next update is due October 1, 2026. Check it before you make any decisions.
Where Do 30-Year Fixed Rates Stand Right Now?
Freddie Mac’s Primary Mortgage Market Survey is the most widely cited national average mortgage rate. Here is the latest snapshot:
| Loan type | Rate (Sept. 24, 2026) | Prior week | One year ago |
|---|---|---|---|
| 30-year fixed | 7.03% | 6.95% | 6.30% |
| 15-year fixed | 6.42% | 6.26% | 5.49% |
Two things stand out.
First, this is a steady climb, not a one-week blip. Freddie Mac’s average was 6.58% in late July and 6.01% in mid-February, when it touched its lowest level since 2022. That means rates are roughly a full percentage point higher than they were at the start of the year.
Second, the survey measures conventional, conforming loans for borrowers with strong credit and 20% down. Freddie Mac bases the figure on applications from thousands of lenders. Your own quote could be higher or lower depending on your credit score, down payment and loan type.
Daily trackers such as Mortgage News Daily usually move ahead of the weekly Freddie Mac number. If bond yields keep rising, lender rate sheets can be higher than the latest weekly figure by the time you apply.
Why Are Mortgage Rates Rising?
In brief: Mortgage rates follow long-term Treasury yields, and those yields have surged on oil-driven inflation worries and a Federal Reserve rate hike.
A few forces are stacking up:
- The 10-year Treasury yield. It climbed above 5% in mid-September and reached about 5.15% on September 24, its highest level since 2007. It started the year near 4.15%, according to CNN.
- Oil prices and the Iran conflict. Analysts cited by Bankrate and TheStreet point to the conflict and higher energy costs as the main pressure on inflation. Higher inflation pushes yields, and mortgage rates, up.
- The Federal Reserve. On September 16, the Fed under Chair Kevin Warsh raised its benchmark rate by a quarter point, its first increase since July 2023, and officials have signaled that more may follow.
The Fed doesn’t set mortgage rates directly. One recent analysis found the gap between the 10-year yield and the 30-year mortgage rate has barely changed since February, at roughly 1.96 percentage points. In other words, nearly all of the rise this year is bond-market movement, not lenders getting greedier. That also means shopping around won’t erase the increase. It can only trim your quote relative to others.
What Will a 7% Rate Do to Your Monthly Payment?
In brief: Every $100,000 borrowed now costs roughly $667 a month in principal and interest at 7.03%, versus about $619 at 6.30%.
Here is how the numbers compare on common loan amounts (principal and interest only, my own calculations, rounded):
| Loan amount | At 6.30% | At 7.03% | Extra per month |
|---|---|---|---|
| $300,000 | ~$1,857 | ~$2,002 | ~$145 |
| $400,000 | ~$2,476 | ~$2,669 | ~$193 |
| $500,000 | ~$3,095 | ~$3,336 | ~$241 |
These figures exclude property taxes, homeowners insurance, mortgage insurance and HOA dues, which can add several hundred dollars a month. Over 30 years, that $193 difference on a $400,000 loan adds up to nearly $70,000 in extra interest.
To test your own scenario, use a mortgage payment calculator. Enter your loan amount, rate and term, then add taxes and insurance for a realistic monthly total.
Should You Consider a 15-Year Mortgage Instead?
In brief: A 15-year fixed loan carries a lower rate (6.42% versus 7.03%) and saves a lot of interest, but the monthly payment is much higher.
On a $400,000 loan, the estimates look like this:
- 30-year at 7.03%: about $2,669 a month, with roughly $561,000 in total interest.
- 15-year at 6.42%: about $3,467 a month, with roughly $224,000 in total interest.
The 15-year option costs about $800 more each month but cuts lifetime interest by more than $300,000. It suits buyers with high, stable income and a comfortable cash cushion. For many households, the 30-year loan’s lower payment is what makes the purchase possible. A common middle path is to take the 30-year loan and make extra principal payments when your budget allows, which keeps flexibility while shortening the payoff time.
How Do 20-Year and 10-Year Mortgage Rates Compare?
Freddie Mac’s weekly survey covers the 30-year and 15-year fixed loans only, so there is no official national average for 20-year or 10-year terms. Lenders that offer them generally price shorter terms below the 30-year rate, but the discount varies. Ask each lender for a written quote on the term you want and compare it against the 15-year and 30-year offers.
What About Other Loan Types?
Not everyone will get the headline rate. Here is how the main options differ:
- Conventional loans follow Freddie Mac and Fannie Mae guidelines and are the benchmark for the national average.
- FHA loans are backed by the Federal Housing Administration, allow lower credit scores and down payments, and come with mortgage insurance premiums.
- VA loans are available to eligible service members and veterans, often with no down payment and no monthly mortgage insurance.
- Jumbo loans exceed conforming loan limits and are priced by each lender, so shop them especially carefully.
- Adjustable-rate mortgages (ARMs) start with a fixed period and then reset. They can offer a lower opening rate, but with the 10-year yield near 5%, the risk of a higher reset is real. Compare the initial rate, caps and margin before choosing one.
How Do You Compare Mortgage Rates by Lender?
In brief: Get at least three written Loan Estimates on the same day, with the same loan amount, credit assumptions and lock period.
Freddie Mac’s chief economist, Sam Khater, has repeatedly told borrowers that getting multiple quotes can save thousands of dollars. Here is a practical process:
- Check your credit reports and fix errors before you apply.
- Request Loan Estimates from a mix of lenders: a large bank such as Wells Fargo or U.S. Bank, a credit union, an online lender and a mortgage broker.
- Compare the APR, not just the rate. The APR folds in many fees and gives a fuller picture of borrowing costs.
- Look at points and fees. One point costs 1% of the loan amount and typically lowers the rate. Whether that pays off depends on how long you will keep the loan.
- Compare lender fees and closing costs line by line on page two of the Loan Estimate.
- Ask about rate locks. In a volatile market, a lock protects you if yields keep rising while you wait to close.
Rate shopping within a short window, usually 14 to 45 days depending on the scoring model, is generally treated as a single inquiry by credit bureaus.
Where Are Mortgage Rates Headed?
In brief: Nobody knows, and the near-term risks lean upward.
Bankrate’s expert panel recently expected rates to drift higher, citing inflation, government debt and Fed tightening. An analyst quoted by TheStreet said meaningful relief probably requires an end to the Iran conflict and lower oil prices. Markets did steady briefly on September 25 on reports of a proposal to reopen the Strait of Hormuz, which shows how quickly sentiment can swing.
My read: watch three things rather than trying to time the bottom.
- The next CPI and jobs reports
- The 10-year Treasury yield, especially whether it holds above 5%
- Oil prices
Any forecast should be treated as a probability, not a promise. If your budget only works at a lower rate, a refinance later is possible, but it is never guaranteed.
How Do Today’s Rates Compare with History?
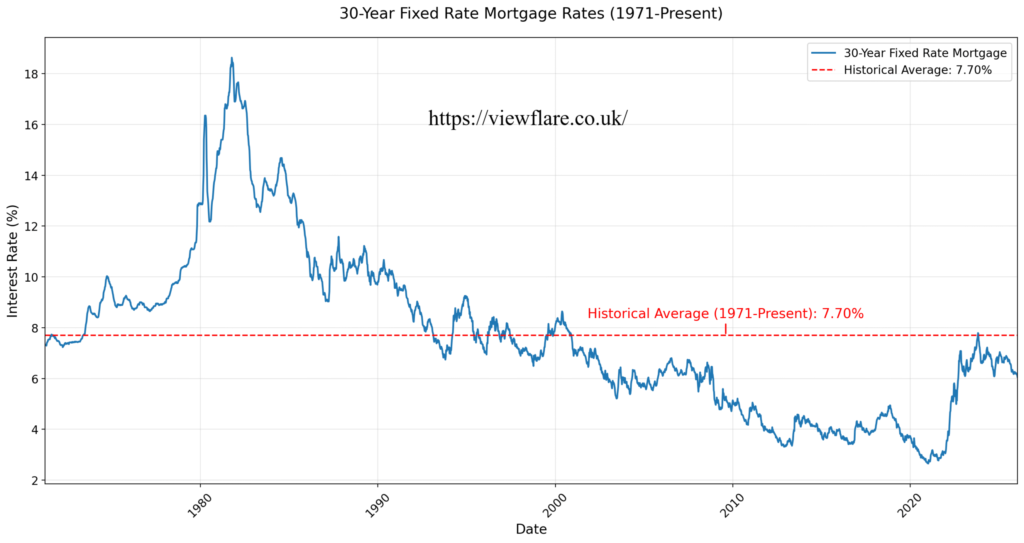
The 30-year mortgage rate has ranged widely since Freddie Mac started tracking it in 1971. It peaked above 18% in 1981, bottomed near 2.65% in early 2021, and reached a recent high of about 7.79% in October 2023. So 7.03% is elevated compared with the past few years, but well below the long-run peak. Most people who bought between 2020 and 2022 locked in far lower rates, which is one reason so many owners are staying put and inventory remains tight.
For a visual, the St. Louis Fed’s FRED database and Freddie Mac’s own site both publish free 30-year mortgage rate charts going back decades.
Frequently Asked Questions
What is the average 30-year mortgage rate today?
According to Freddie Mac’s most recent survey (September 24, 2026), the average 30-year fixed mortgage rate is 7.03%. The figure updates every Thursday, and individual lender quotes vary.
Is there a 30-year mortgage rates chart I can look at?
Yes. Freddie Mac’s Primary Mortgage Market Survey page and the Federal Reserve Bank of St. Louis (FRED) both offer interactive charts of weekly 30-year fixed rates. FRED’s series goes back to 1971.
Is there a 30-year mortgage calculator?
Yes. A mortgage calculator takes your loan amount, interest rate and loan term and returns your estimated monthly principal and interest. Many lenders and sites such as Bankrate and Mortgage News Daily offer free versions that also let you add taxes and insurance.
How do 15-year and 30-year mortgage rates compare today?
As of September 24, 2026, the 15-year fixed averaged 6.42% and the 30-year fixed averaged 7.03%, a gap of about 0.6 percentage points. The 15-year loan saves substantial interest but has a much higher monthly payment.
What are current 15-year mortgage rates?
Freddie Mac reported a 15-year fixed average of 6.42% on September 24, 2026, up from 6.26% the week before and 5.49% a year earlier.
What are 20-year mortgage rates?
Freddie Mac does not publish a national average for 20-year loans. Lenders that offer this term set their own pricing, generally between the 15-year and 30-year rates, so request quotes directly.
What are 10-year mortgage rates?
There is no official national average for 10-year fixed mortgages either. Lenders typically price them below longer terms, but the monthly payments are very high, so they are rarely used for home purchases.
Where can I find a historical mortgage rates chart?
Freddie Mac and FRED both publish free historical charts of the 30-year fixed rate from 1971 onward, including the 1981 peak above 18% and the early-2021 low near 2.65%.
Read More…
What Business Are Closed Today?